In 2021, we announced Cloud SQL Insights, an easy to use tool that helps developers quickly understand and resolve database performance issues in Cloud SQL for PostgreSQL. We designed Insights using open standards, with intuitive visualizations and modern architectures, such as microservices, in mind.
Insights became one of the fastest adopted new capabilities in Cloud SQL, so it was no surprise that many of our customers asked for the same functionality for MySQL, the other most widely used open-source relational database. Today, we’re happy to announce that support for Cloud SQL for MySQL is available in preview.
Let’s take the opportunity to review the benefits of Cloud SQL Insights for application developers and DBAs and the significance of MySQL support.
Why is it difficult to keep up with database performance problems?
Application development teams are shipping features faster than ever before. With the rise of DevOps, what was once an event a few times a year has shifted to multiple releases per week, or even several a day. In addition, more application users are spread around the globe, continuously creating load on your applications. If performance issues aren’t properly identified during development, they may show up in production. When performance issues arise, the database is often the root cause.
More ownership of the development lifecycle has now moved to software developers. However, developers may not have the skills or tools to solve database performance problems, and they’ll need to wait their turn if they turn to database experts, such as DBAs, for help. DBAs are now a scarce resource, heavily outnumbered by developers and overloaded as they try to meet the demand of today’s data-driven businesses. More often than not, urgent performance issues are left unresolved, resulting in poor end user experiences.
Introducing Cloud SQL Insights for MySQL
Insights, a feature of Cloud SQL on Google Cloud, helps developers diagnose and provide a resolution for MySQL database performance problems on their own, allowing for faster iteration on application development and freeing DBAs to work on more strategic tasks like data modeling, query optimization, and data analysis.
Let’s dive a little deeper into Insights’ capabilities.
Application-centric database observability
Traditional monitoring tools provide a query-centric view of performance. This is a limitation since it creates a disconnect between performance and application code, especially with modern architectures.
Insights provides developers with database monitoring through the lens of the application. You can use tags to associate queries with specific business functions, such as payments, inventory, business analytics, and shipping. For example, you can quickly evaluate the database load contributed by specific microservices or user flows.
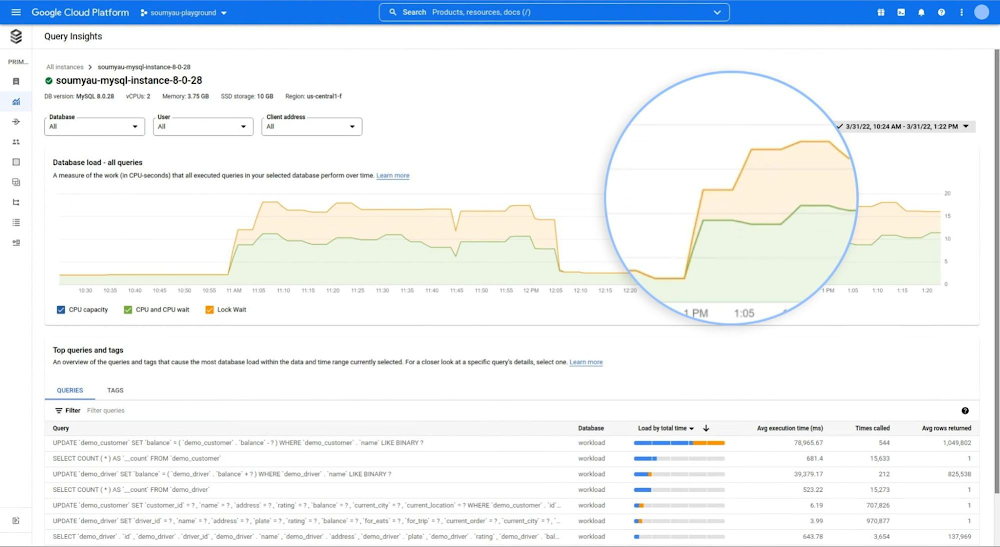
Insights provides a holistic view of performance organized by business function rather than query. Here’s a look at database load sorted by tags:
In many applications, Object-Relational Mappers (ORMs) simplify database query development. However, ORMs tend to generate inefficient queries that are very difficult to diagnose. Insights integrates with Sqlcommenter, an open-source library that enables your ORMs to add comments to SQL statements to help you identify which application code is causing problems.
Sqlcommenter automatically creates query tags, so you don’t need to make any changes to application code. It supports many popular ORMs, such as Hibernate, Spring, Django, Flask, and others. Learn more about Sqlcommenter.
Self-service experience for query diagnostics
Database performance troubleshooting brings a few important challenges: quickly determining which query is causing the problem, finding the root cause of the problem, and identifying the specific application code causing the problem. Today, you likely have to rely on multiple tools to correlate data, a task that requires expertise and time. In the cloud, the challenge increases further as development teams often use multiple database engines for different use cases.
Insights for MySQL allows you to move from detection to diagnosis seamlessly, using a single interface. Similar to Cloud SQL Insights for PostgreSQL, you can identify query performance problems early with pre-built dashboards. Here’s an example:
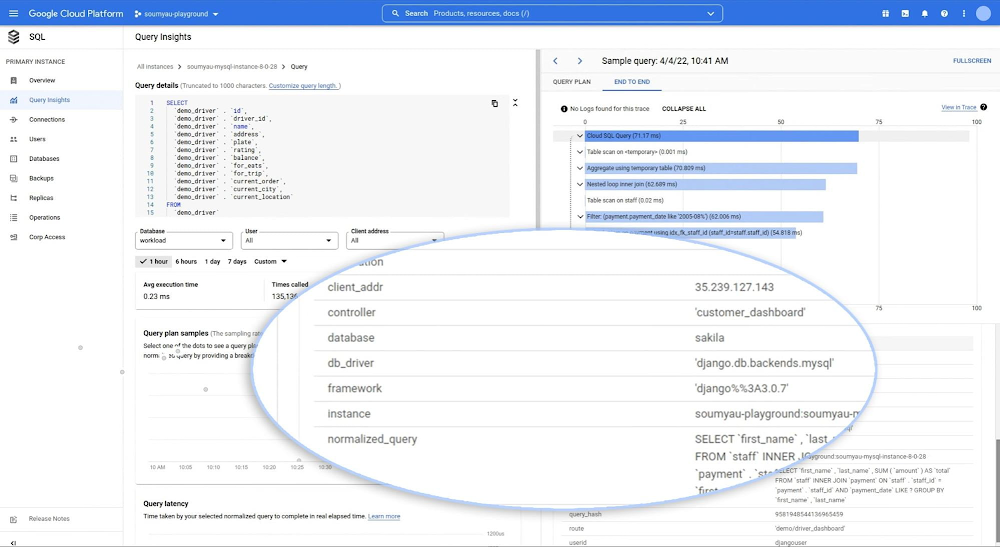
This end-to-end application trace helps determine the source of the problematic query in context, including by model, view, controller, route, user, and host. And visual query plans give insights into the root cause of performance problems. Here’s a look at that view:
Insights manages the collection of telemetry for diagnostics and reduces the performance impact on the database and the time you spend managing third-party monitoring products. To safeguard your data, all performance metrics are protected by Google Cloud’s enterprise-class security, privacy, and compliance.
Database observability with your favorite tools and open standards
For DevOps to work effectively, it’s imperative that the database be included seamlessly in the software development lifecycle, allowing a variety of stakeholders like developers, SREs, platform engineers, and DBAs to collaborate on troubleshooting database performance issues. This requires access to database telemetry across various enterprise monitoring tools—for example, developers want access to database traces in their favorite APM tool, while SREs want to access critical database signals in their operational dashboard.
Insights helps increase database observability within existing tools, enabling developers and operations teams to address issues early and save time on troubleshooting. Unlike alternative approaches that require installing APM agents on top of the database, which can cause security concerns and performance overhead, Insights provides database metrics and traces through the open standard OpenTelemetry and the Cloud Monitoring and Cloud Trace APIs. As a result, it’s easy to execute end-to-end tracing in your existing tools and get a full-stack view of all your environments, from the application to the database.
Insights also integrates with Cloud Monitoring, letting you quickly create custom dashboards and alerts on query metrics or tags and receive notifications via email, SMS, Slack, PagerDuty, and more. Cloud Monitoring also allows you to build customized dashboards.
Sign up for the Insights for MySQL preview
Cloud SQL Insights for MySQL is now in preview. Sign up to join, and be sure to provide your feedback!


